LA Lakers Player Statistics: LeBron James Scoring Analysis
This webpage explores sports analytics through a focused analysis of LA Lakers player statistics, specifically LeBron James’s scoring performance during the 2025–26 NBA season. By examining raw game data, published statistical visualizations, and contextual game information, this page demonstrates how numerical data can be transformed into meaningful information and actionable knowledge. The goal is to help a motivated consumer understand how to use multiple data sources to identify performance trends, strengths, and strategic opportunities.
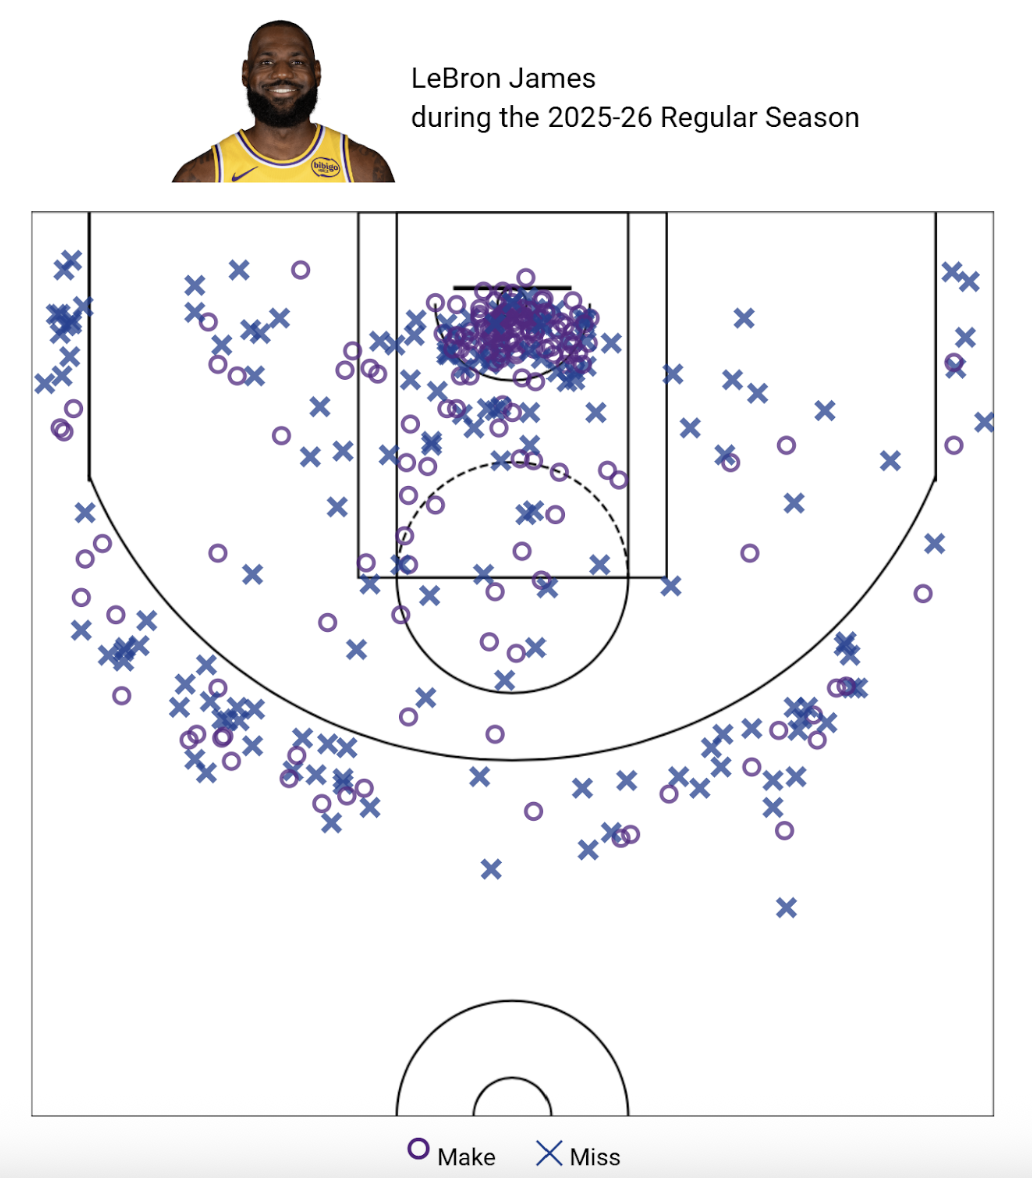
Figure 1. LeBron James season shot chart showing made and missed shots by location.
Source: NBA.com Shot Chart
This shot chart (Fig 1) visualizes LeBron James’s shot attempts across the court, displaying both made and missed shots by location. By mapping each attempt spatially, the chart reveals patterns in scoring efficiency that are not apparent in raw numerical statistics alone. Clusters of made shots near the basket indicate higher efficiency in close-range scoring, while more dispersed makes and misses beyond the three-point line suggest greater variability from long-range attempts. This information helps identify LeBron’s offensive strengths and can inform strategic decisions about shot selection and play design.
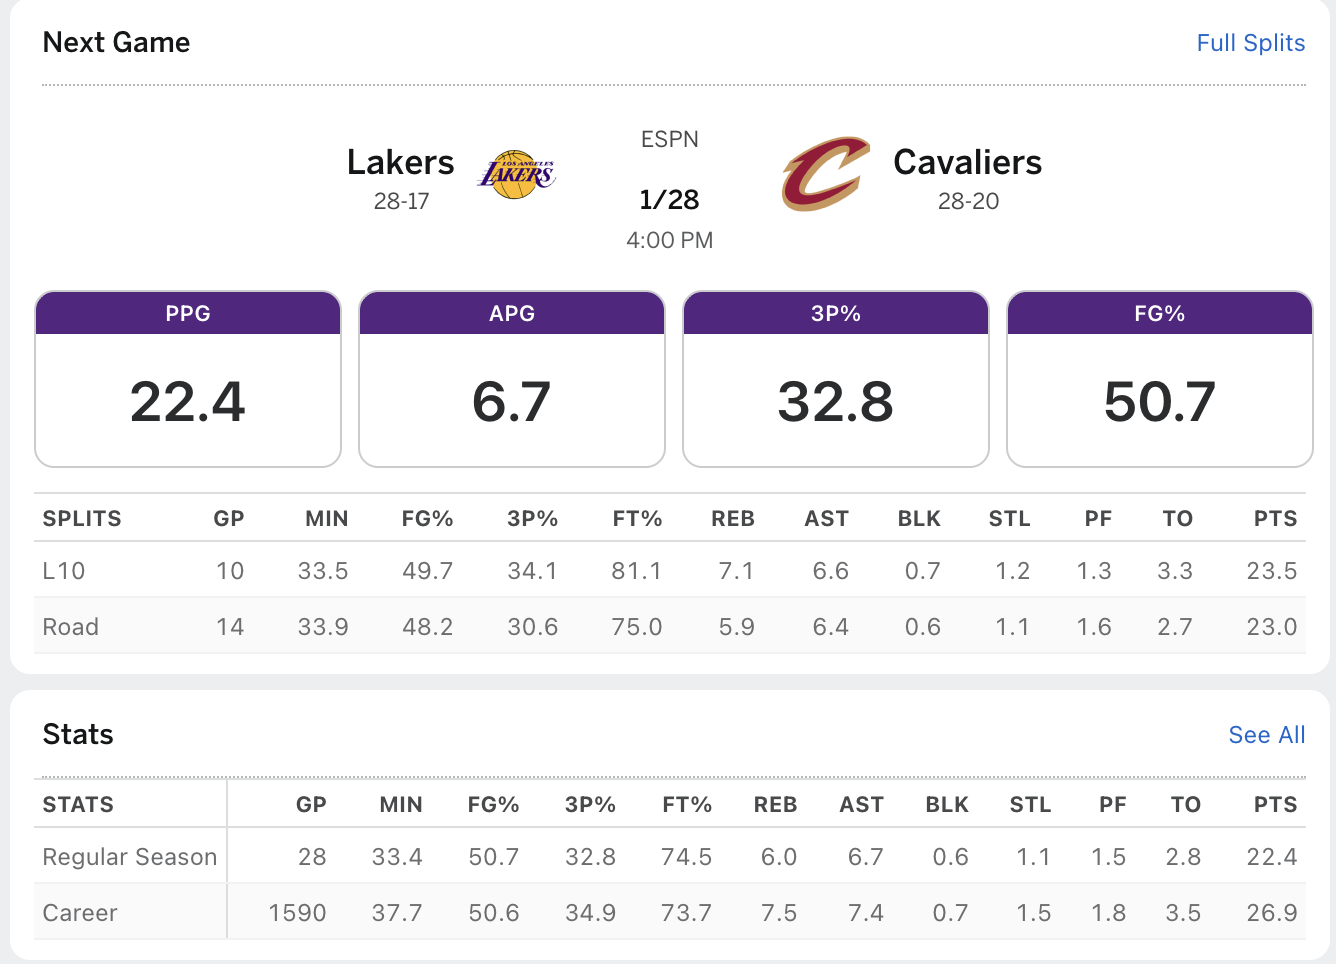
Source: espn.com
(Fig 2)The game log organizes LeBron James’s scoring performance across the 2025–26 regular season, allowing trends to be observed over time rather than in isolation. Early-season averages in November show lower scoring output, while later months—particularly January—reflect a noticeable increase in points per game. This upward trend suggests improved rhythm, conditioning, or changes in team strategy and usage as the season progresses.
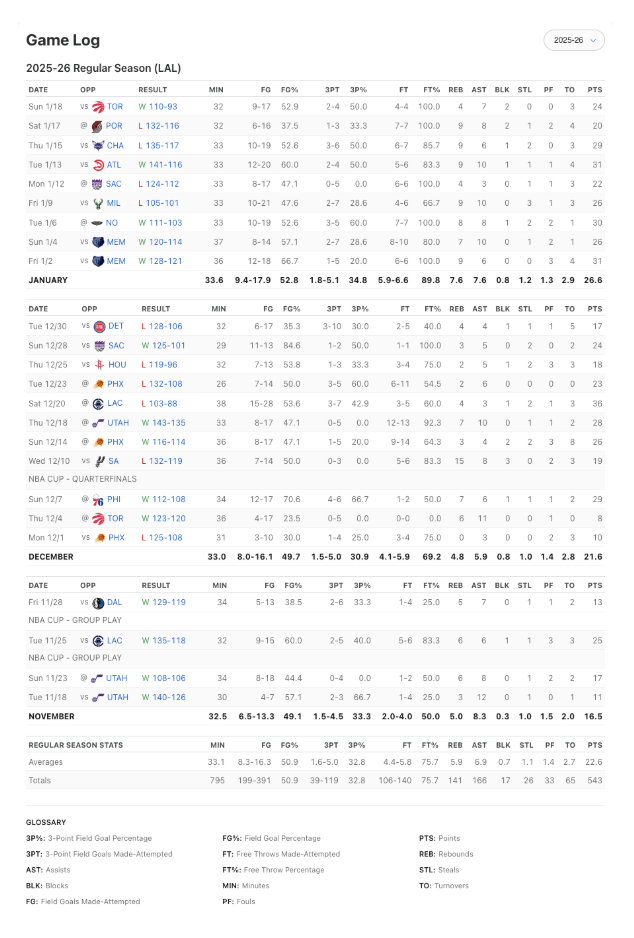
Figure 2. LeBron James game log displaying points scored across the 2025–26 season.
Source: Basketball-Reference Game Log
The log also highlights variability in individual games, with point totals ranging from lower-scoring outings to multiple games above 30 points. When examined alongside minutes played, higher scoring performances often align with increased minutes and shot attempts, indicating that opportunity plays a significant role in total points. This demonstrates that raw scoring totals must be interpreted in context, rather than as standalone indicators of performance.
Overall, the game log transforms raw box score data into meaningful information by revealing consistency, streaks, and seasonal progression. From this information, users can gain knowledge about when LeBron is most impactful and how factors such as workload and game context influence scoring outcomes.
Together, the shot chart, game log, and box score provide a comprehensive view of LeBron James’s scoring performance during the 2025–26 season. The shot chart visualizes where LeBron takes and makes shots on the court, revealing areas of high scoring efficiency near the basket and greater variability from long-range attempts. The game log organizes scoring data across the season, allowing trends such as increases in points per game and periods of consistency or fluctuation to be identified over time. Finally, the box score offers contextual detail for individual games, showing how factors such as minutes played, shot attempts, and game flow influence scoring outcomes. Combined, these charts transform raw statistical data into meaningful information that helps users understand not only how much LeBron scores, but where, when, and why those performances occur.